Google Charts or graph with PHP, Mysql and AJAX
Here we will learn Google Charts with PHP, Mysql and AJAX like Pie Chart, Column Chart, Bar Chart, Line Chart. Charts or graph are used for graphical representation of data and are useful when you want to show your data or information in quick overview format. There are lot of way to show information in meaningful way like tabular, graph and chart.
Today we will discuss about Google charts with PHP. Google chart are best option on web to show your information in graphical way. You can create charts very quickly by using Google chart. It is simple to use and free. Google charts have rich set of gallery of interactive charts and easy to customizable.
As a result, It connect to data in real time using a variety of data connection tool. You can customize it according to need like increasing size of graph and change color of graph and make your application more interactive by adding interactive chart gallery.
If you are thinking to generate various charts using Database (MYSQL) and PHP then this tutorial is for you. Here we will explain about mostly used Google charts in any web applications as follows:
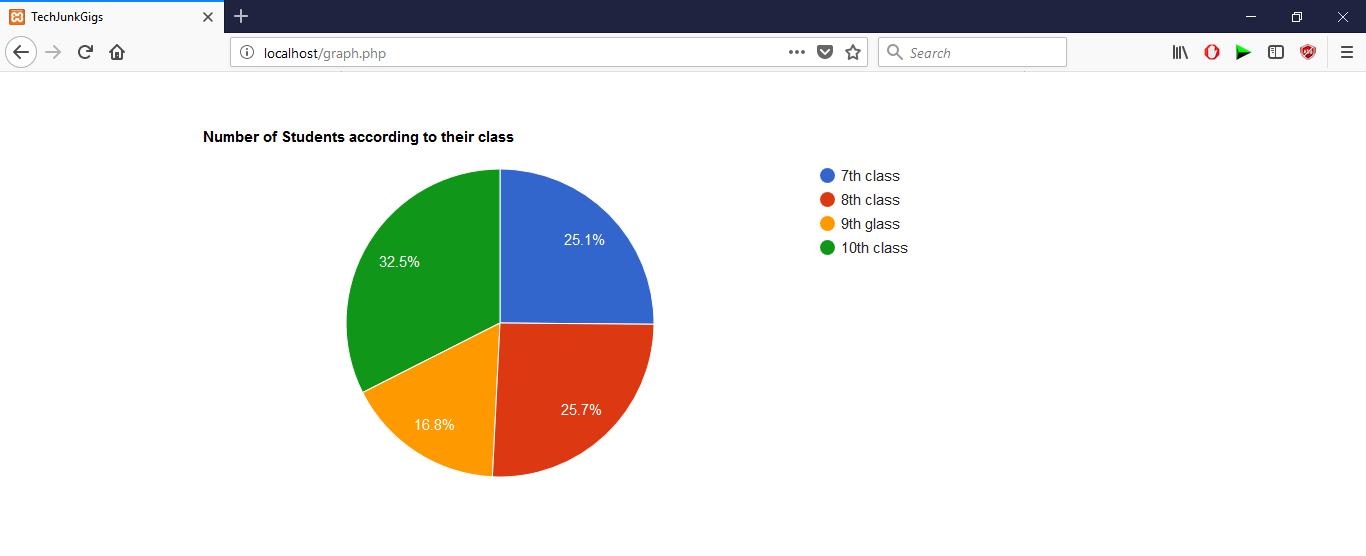
Pie Chart
Pie Chart is a special chart that uses pie slices to show relative size of data. Information or Data will divided into number of slice. Pie charts are very widely used in the business world. In this example, we will use MYSQL table data for making JSON format.
Let’s say, An Employee gave interview in which he got marks per subject wise as follows shown below. This information can be shown by Pie Chart.
Now we will store this information in courses table of graph database and will present these information into pie chart as follows:
1. Create Database graph from phpmyadmin or you can create by running following query in SQL Tab as shown below.

2. Create Table courses in graph database with following query as shown below:
3. Insert employee marks into course table with following mysql query as shown below:
4. Create graph.php with following code as shown below. In this file, firstly we have loaded Google chart libraries in the head of page. After loading libraries pie_chart() function will call to get JSON format data from pie_chart.php file and will append to piechart_div.
5. Create another file pie_chart.php with following code as shown below. This file will fetch all data from database and will return to pie_chart() function.
array("0"=>array("v"=>$result['subject'],"f"=>NULL),"1"=>array("v"=>(int)$result['number'],"f" =>NULL))); > echo $format = '< "cols": [ , ], "rows":'.json_encode($rows).'>'; ?>
When you will execute graph.php file on server or localhost will show following page as shown below:
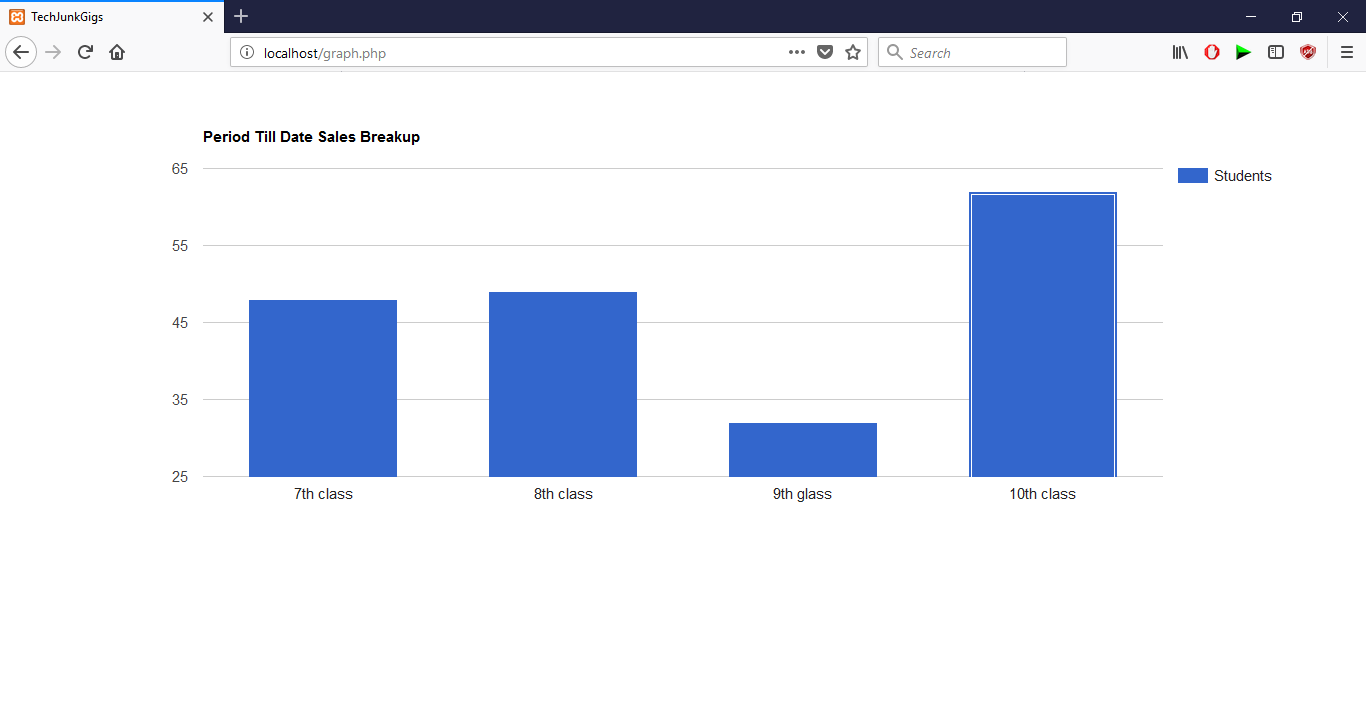
Column Chart
Column charts display data as vertical bars. It is useful for showing data changes over period of time. You can add special drawing styles to the individual bars on column chart to increase visual impact. We will make column chart with above data of employee got marks in interview.
1. Add following code into graph.php as shown below. Here column_chart is a function is used to get data from column_chart.php file by using Ajax. After that result will append to columnchart_values div.
google.charts.setOnLoadCallback(column_chart); function column_chart() < var jsonData = $.ajax(< url: column_chart.php', dataType:"json", async: false, success: function(jsonData) < var data = new google.visualization.arrayToDataTable(jsonData); var chart = new google.visualization.ColumnChart(document.getElementById('columnchart_values')); chart.draw(data); >>).responseText; >2. Create another file column_chart.php to fetch all data from database and return data in JSON format to graph.php file with following code:
$con = mysql_select_db("graphs"); if(!$sql) < echo "Database Not Connected"; >$data[] = array('Employee','Markes'); $sql = "select * from courses"; $query = mysql_query($sql); while($result = mysql_fetch_array($query)) < $data[] = array($result['subject'],(int)$result['number']); >echo json_encode($data); ?> 
Now when you run graph.php file will have the following screen as shown below:
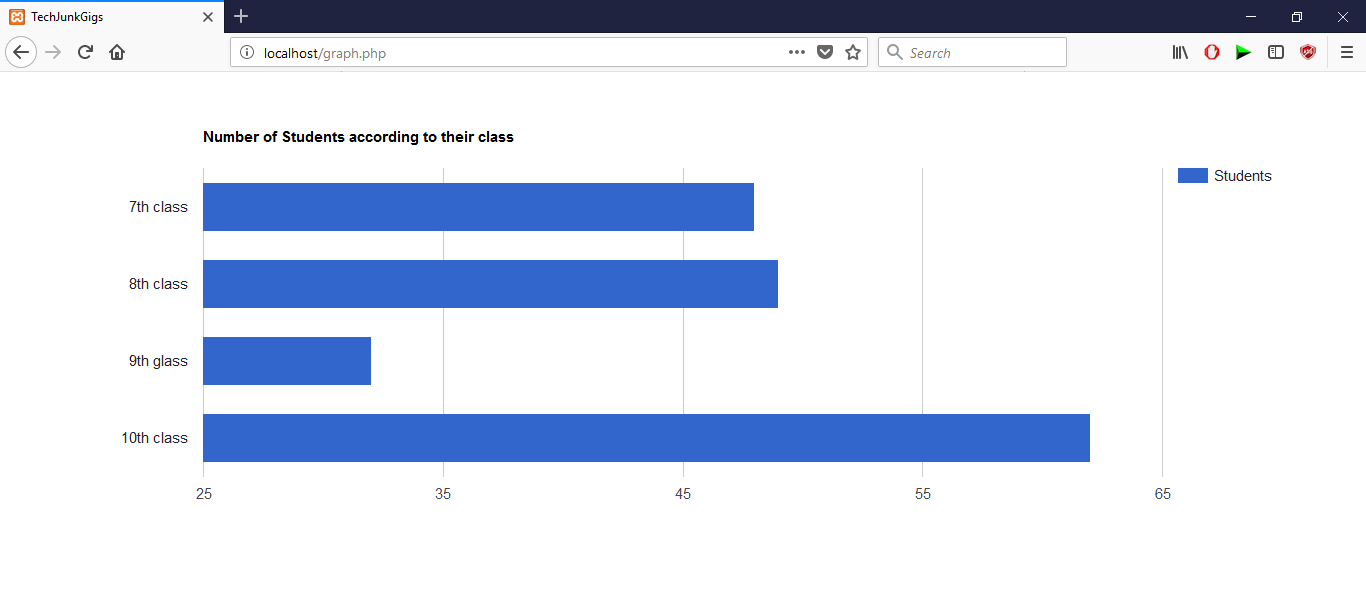
Bar Chart
The Bar chart is exactly same as column chart only the x-axis and y-axis are switched. To make Bar chart follow these steps:
1. Add following bar_chart() function to get data from column_chart.php file with following code as shown below. Here we have not created new php file instead using column_chart.php for fetching information from database.

Now Run graph.php on server or localhost will have the following screen as shown below:
Line Chart
A line chart is a type of chart which displays information as a series of data points called markers connected by straight line segments. It is a basic type of chart is used commonly in many fields. Line charts are most often used to visualize data that changes over time.To make Line chart follow these steps:
1. Add following line_chart() function to get data from column_chart.php file with following code as shown below. Here we have not created new php file instead using column_chart.php for fetching information from database.
, curveType: 'function', pointSize: 7, dataOpacity: 0.3 >; var data = new google.visualization.arrayToDataTable(jsonData); var chart = new google.visualization.LineChart(document.getElementById('line_chart')); chart.draw(data, options); > >).responseText; >
Now Run graph.php on server or localhost will have the following screen as shown below:
Now we have implemented different types of Google Charts in php, mysql and ajax. Above all example will help you to implement multiple types of google chart using php, mysql and ajax. if you have any query, Feel free to ask in comment section.
He is a continuous blogger and has blogged on different topic. He loves to surf Internet and always trying to get new Idea about new Technology and Innovations and sharing these great information to all the technology lovers.
Google Charts in PHP with MySQL Database using Google API
“Google Charts in PHP with MySQL Database using Google API”, Pie Chart, Column Chart, Bar Chart, Line Chart. Charts or graph are used for graphical representation of data and are useful when you want to show your data or information in quick overview format.
Today we will discuss about Google charts with PHP and MySQL database. Google chart are best option on web to show your information in graphical way. You can create charts very quickly by using Google chart. It is simple to use and free. It connect to data in real time using a variety of data connection tool. You can customize it according to need like increasing size of graph and change color of graph and make your application more interactive by adding interactive chart gallery.
Create table in MySQL Database
CREATE TABLE IF NOT EXISTS `class` ( `id` int(11) NOT NULL, `class_name` varchar(20) NOT NULL, `students` int(11) NOT NULL ) ENGINE=InnoDB AUTO_INCREMENT=5 DEFAULT CHARSET=latin1;
Insert Data into Table
INSERT INTO `class` (`id`, `class_name`, `students`) VALUES (1, '7th class', 48), (2, '8th class', 49), (3, '9th glass', 32), (4, '10th class', 62);
Database Connection
Here ‘cbir’ is the database name which is i’m using
PHP code for retrieving data from database
All code together for Pie chart.
Here is the result we generated
For other chart we need only change the chart name on below code
var chart = new google.visualization.PieChart(document.getElementById("columnchart12")); chart.draw(data,options); new google.visualization.PieChart (……………………………………..)
Donut Chart
For donut chart we don’t change PieChart because donut chart is the form pie chart with hole in center
so you change in code like
ColumnChart
So that’s all for this “Google Charts with PHP and MySQL Database” friends. We learned how to create google chart with PHP and MySQL data. if you found it helpful then, please SHARE. Thank You