Use Python in Power Query Editor
You can use Python, a programming language widely used by statisticians, data scientists, and data analysts, in the Power BI Desktop Power Query Editor. This integration of Python into Power Query Editor lets you perform data cleansing using Python, and perform advanced data shaping and analytics in datasets, including completion of missing data, predictions, and clustering, just to name a few. Python is a powerful language, and can be used in Power Query Editor to prepare your data model and create reports.
Prerequisites
You’ll need to install Python and pandas before you begin.
- Install Python — To use Python in Power BI Desktop’s Power Query Editor, you need to install Python on your local machine. You can download and install Python for free from many locations, including the Official Python download page, and the Anaconda.
- Install pandas — To use Python with the Power Query Editor, you’ll also need to install pandas. Pandas is used to move data between Power BI and the Python environment.
Use Python with Power Query Editor
To show how to use Python in Power Query Editor, take this example from a stock market dataset, based on a CSV file that you can download from here and follow along. The steps for this example are the following procedure:
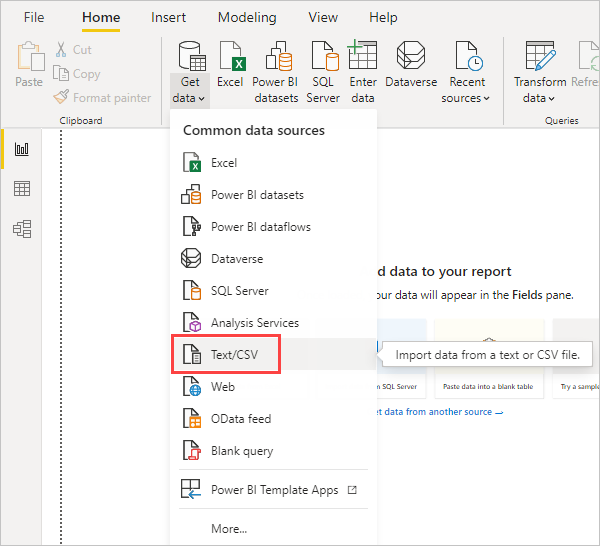
- First, load your data into Power BI Desktop. In this example, load the EuStockMarkets_NA.csv file and select Get data >Text/CSV from the Home ribbon in Power BI Desktop.

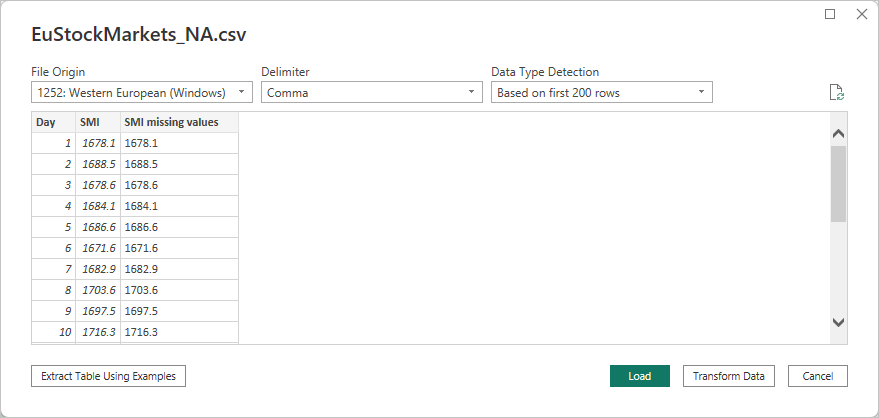
- Select the file and select Open, and the CSV is displayed in the CSV file dialog.
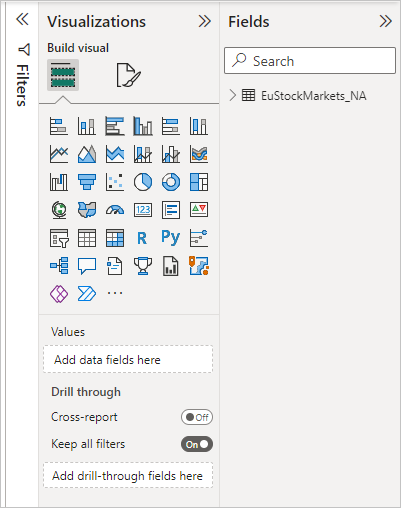
- Once the data is loaded, you see it in the Fields pane in Power BI Desktop.
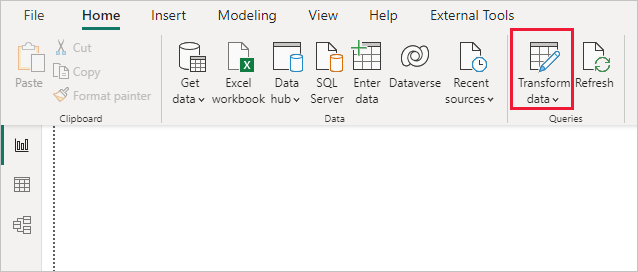
- Open Power Query Editor by selecting Transform data from the Home tab in Power BI Desktop.
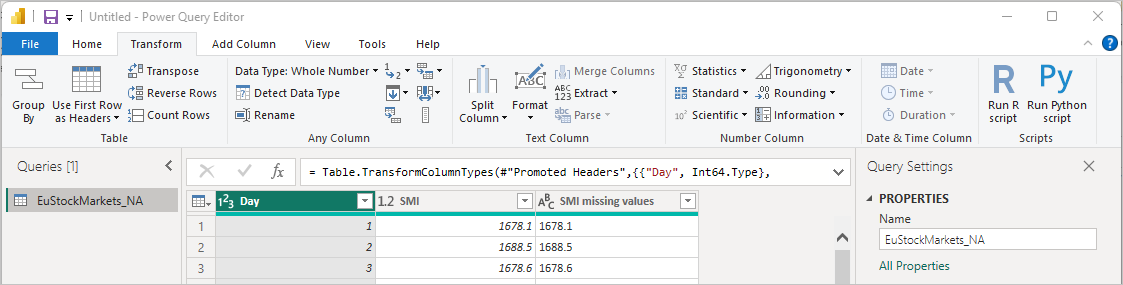
- In the Transform tab, select Run Python Script and the Run Python Script editor appears as shown in the next step. Rows 15 and 20 suffer from missing data, as do other rows you can’t see in the following image. The following steps show how Python completes those rows for you.
- For this example, enter the following script code:
import pandas as pd completedData = dataset.fillna(method='backfill', inplace=False) dataset["completedValues"] = completedData["SMI missing values"] Note You need to have the pandas library installed in your Python environment for the previous script code to work properly. To install pandas, run the following command in your Python installation: pip install pandas
When put into the Run Python Script dialog, the code looks like the following example: 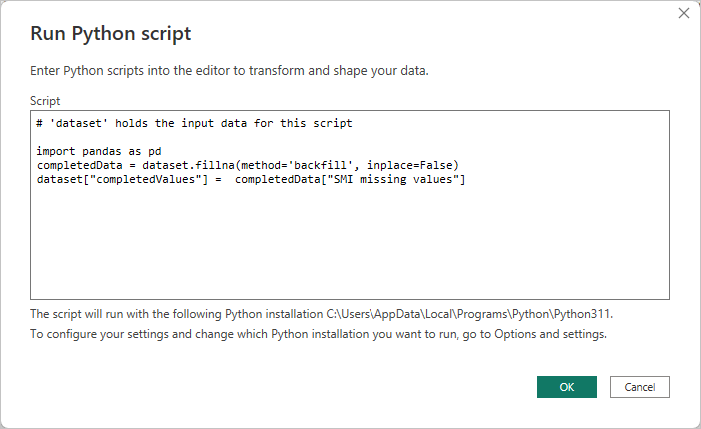
 Notice a new column in the Fields pane called completedValues. Notice there are a few missing data elements, such as on row 15 and 18. Take a look at how Python handles that in the next section.
With just three lines of Python script, Power Query Editor filled in the missing values with a predictive model.
Create visuals from Python script data
Now we can create a visual to see how the Python script code using the pandas library completed the missing values, as shown in the following image:
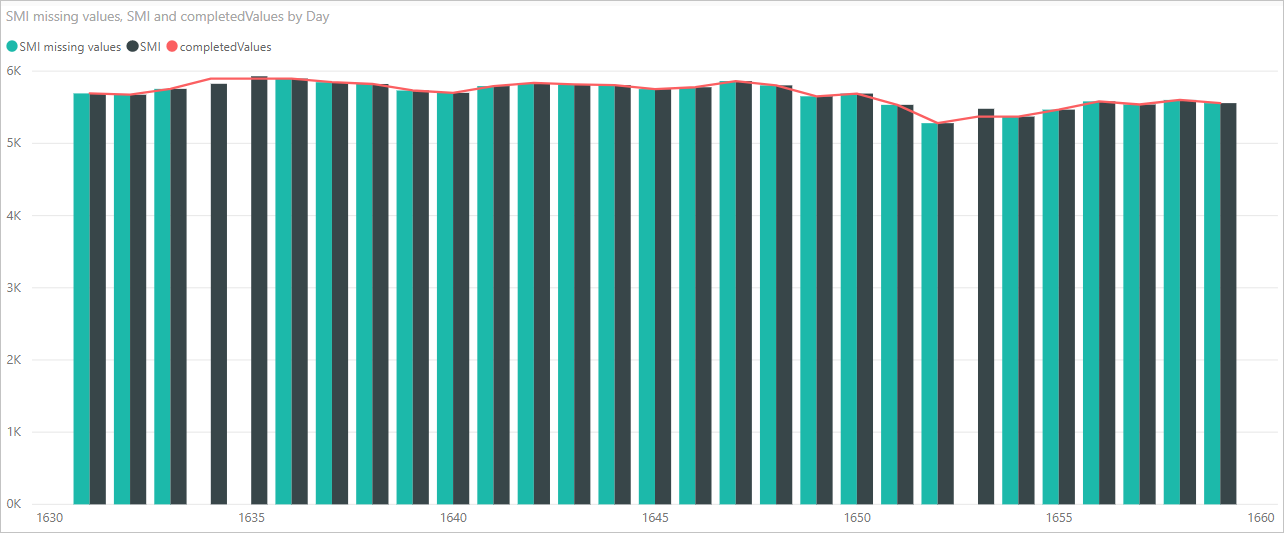
Once that visual is complete, and any other visuals you might want to create using Power BI Desktop, you can save the Power BI Desktop file. Power BI Desktop files save with the .pbix file name extension. Then use the data model, including the Python scripts that are part of it, in the Power BI service.
Want to see a completed .pbix file with these steps completed? You’re in luck. You can download the completed Power BI Desktop file used in these examples right here.
Once you upload the .pbix file to the Power BI service, a couple more steps are necessary to enable data to refresh in the service and to enable visuals to be updated in the service. The data needs access to Python for visuals to be updated. The other steps are the following steps:
- Enable scheduled refresh for the dataset. To enable scheduled refresh for the workbook that contains your dataset with Python scripts, see Configuring scheduled refresh, which also includes information about Personal Gateway.
- Install the Personal Gateway. You need a Personal Gateway installed on the machine where the file is located, and where Python is installed. The Power BI service must access that workbook and re-render any updated visuals. For more information, see install and configure Personal Gateway.
Considerations and limitations
There are some limitations to queries that include Python scripts created in Power Query Editor:
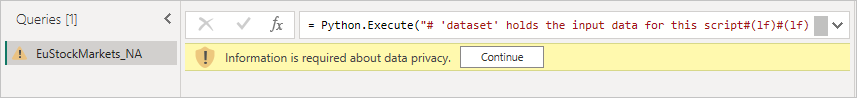
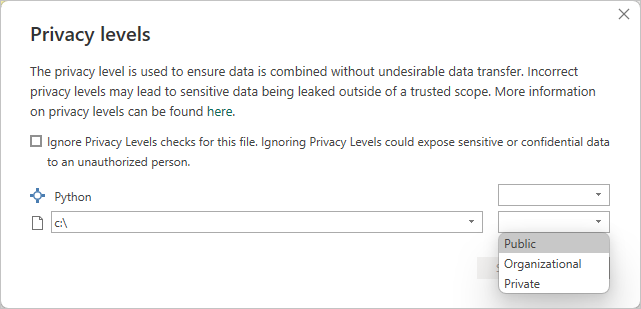
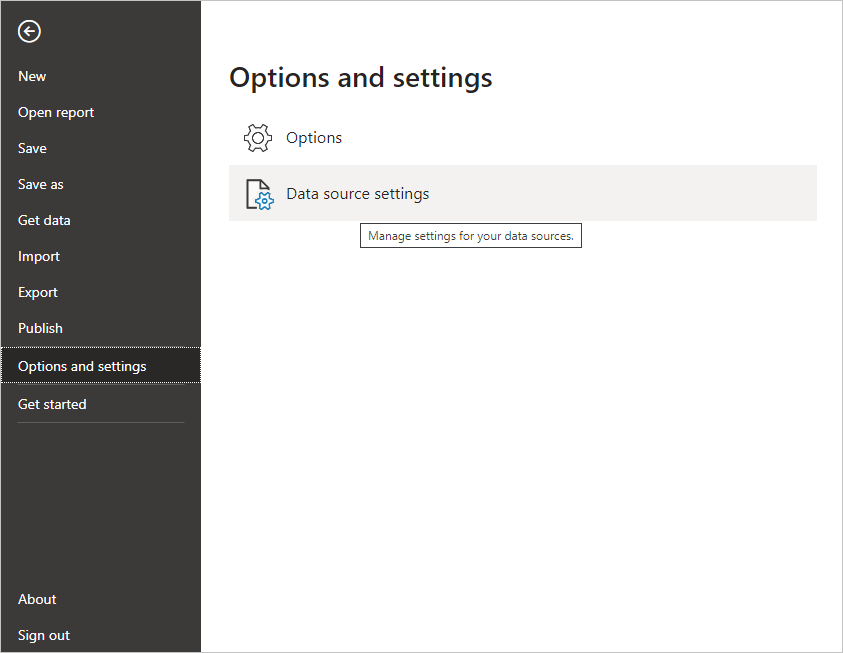
- All Python data source settings must be set to Public, and all other steps in a query created in Power Query Editor must also be public. To get to data source settings, in Power BI Desktop select File > Options and settings > Data source settings. From the Data Source Settings dialog, select the data sources and then select Edit Permissions. and ensure that the Privacy Level is set to Public.
- To enable scheduled refresh of your Python visuals or dataset, you need to enable Scheduled refresh and have a Personal Gateway installed on the computer that houses the workbook and the Python installation. For more information on both, see the previous section in this article, which provides links to learn more about each.
- Nested tables, which are table of tables, are currently not supported.
 From the Data Source Settings dialog, select the data sources and then select Edit Permissions. and ensure that the Privacy Level is set to Public.
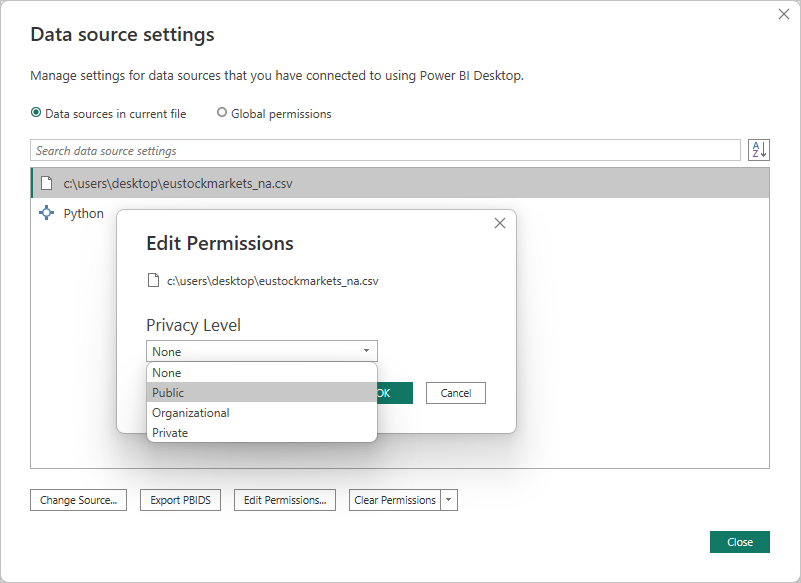
There are all sorts of things you can do with Python and custom queries, so explore and shape your data just the way you want it to appear.
Feedback
Submit and view feedback for
Run Python scripts in Power BI Desktop
You can run Python scripts directly in Power BI Desktop and import the resulting datasets into a Power BI Desktop data model. From this model, you can create reports and share them on the Power BI service.
Prerequisites
- To run Python scripts in Power BI Desktop, you need to install Python on your local machine. You can download Python from the Python website. The current Python scripting release supports Unicode characters and spaces in the installation path.
- The Power BI Python integration requires installation of the following two Python packages. In a console or shell, use the pip command-line tool to install the packages. The pip tool is packaged with recent Python versions.
- Pandas is a software library for data manipulation and analysis. Pandas offers data structures and operations for manipulating numerical tables and time series. To import into Power BI, Python data must be in a pandas data frame. A data frame is a two-dimensional data structure, such as a table with rows and columns.
- Matplotlib is a plotting library for Python and its numerical mathematics extension NumPy. Matplotlib provides an object-oriented API for embedding plots into general-purpose graphical user interface (GUI) applications for Python, such as Tkinter, wxPython, Qt, or GTK+.
pip install pandas pip install matplotlibEnable Python scripting
To enable Python scripting in Power BI:
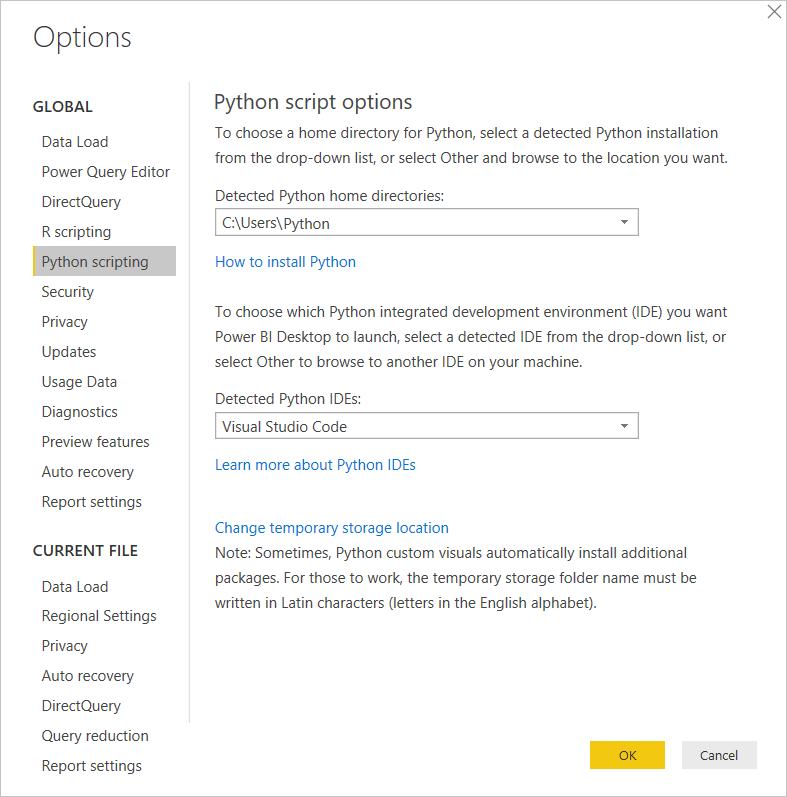
- In Power BI Desktop, select File >Options and settings >Options >Python scripting. The Python script options page appears.
- If necessary, supply or edit your local Python installation path under Detected Python home directories. In the preceding image, the Python’s installation local path is C:\Python. If you have more than one local Python installation, make sure to select the one that you want to use.
- Select OK.
Power BI runs scripts directly by using the python.exe executable from the directory you provide in Settings. Python distributions that require an extra step to prepare the environment, such as Conda, might fail to run. To avoid these issues, use the official Python distribution from https://www.python.org. Another possible solution is to start Power BI Desktop from your custom Python environment prompt.
Create a Python script
Create a script in your local Python development environment and make sure it runs successfully. To prepare and run a Python script in Power BI Desktop, there are a few limitations:
- Only pandas data frames import, so make sure the data you want to import to Power BI is represented in a data frame.
- Any Python script that runs longer than 30 minutes times out.
- Interactive calls in the Python script, such as waiting for user input, halt the script’s execution.
- If you set a working directory within the Python script, you must define a full path to the working directory rather than a relative path.
- Nested tables aren’t supported.
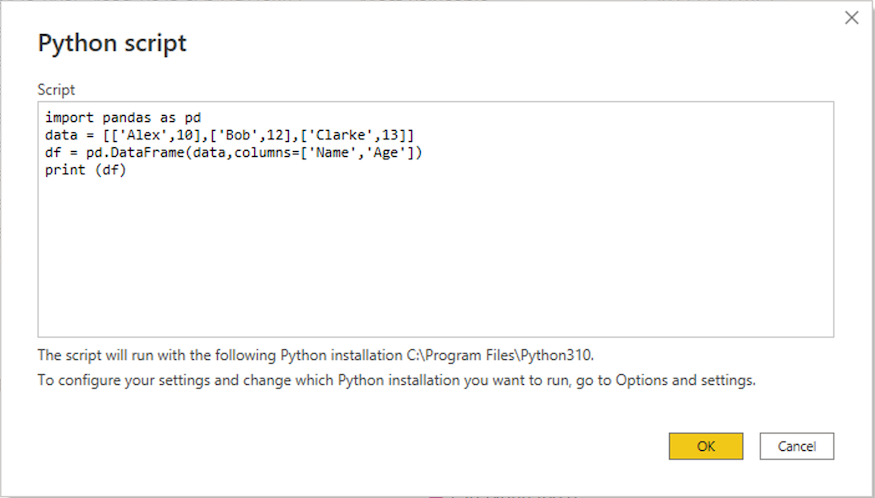
Here’s a simple example Python script that imports pandas and uses a data frame:
import pandas as pd data = [['Alex',10],['Bob',12],['Clarke',13]] df = pd.DataFrame(data,columns=['Name','Age'],dtype=float) print (df)When run, this script returns:
Name Age 0 Alex 10.0 1 Bob 12.0 2 Clarke 13.0Run the script and import data
To run your Python script:
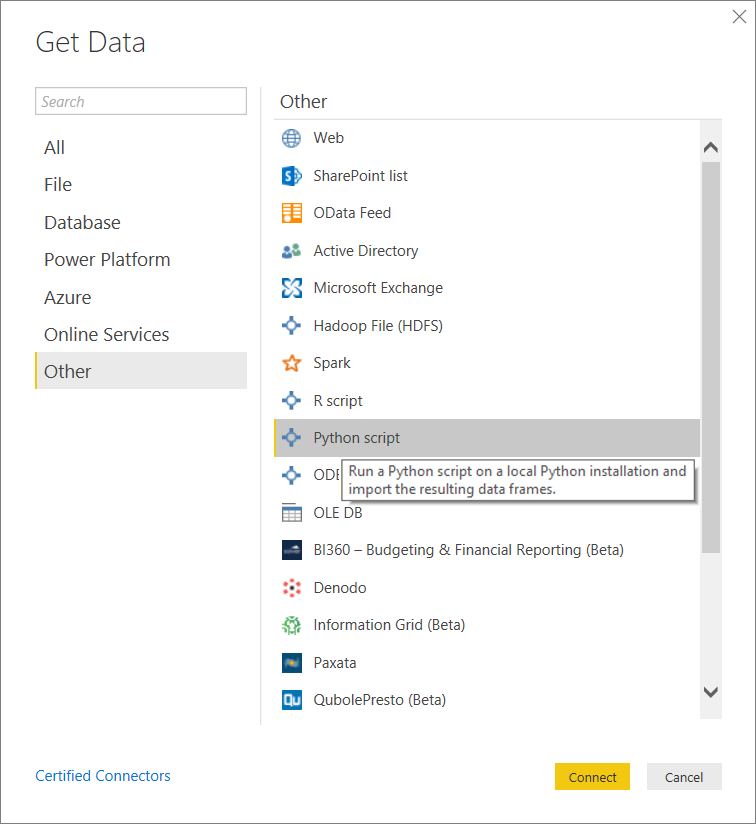
- In the Home group of the Power BI Desktop ribbon, select Get data.
- In the Get Data dialog box, select Other >Python script, and then select Connect. Power BI uses your latest installed Python version as the Python engine.
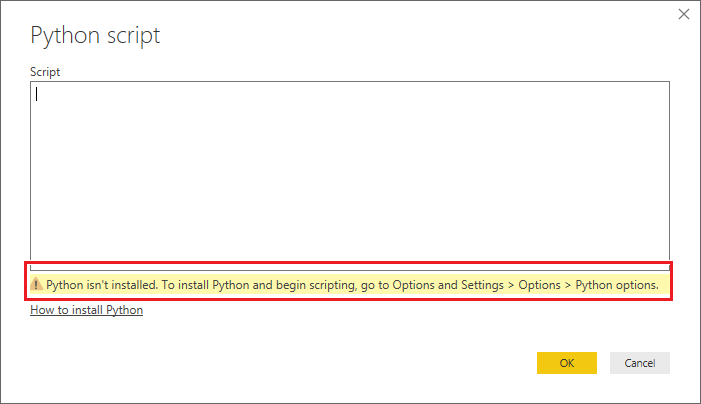
- On the Python script screen, paste your Python script into the Script field, and select OK.
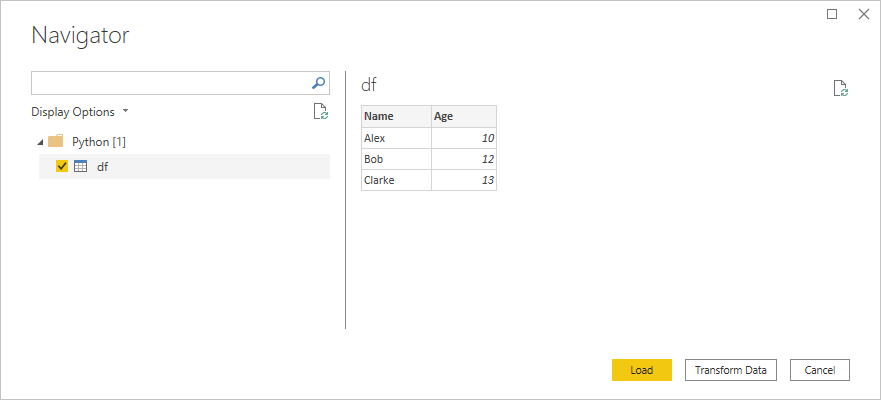
- If the script runs successfully, the Navigator window appears, and you can load the data. Select the df table, and then select Load.
Power BI imports the data, and you can use it to create visualizations and reports. To refresh the data, select Refresh in the Home group of the Power BI Desktop ribbon. When you refresh, Power BI runs the Python script again.
If Python isn’t installed or identified, a warning appears. You might also get a warning if you have multiple local machine installations.
Next steps
For more information about Python in Power BI, see: